
Feed calculators for animal-feed and ingredient buyers.
Estimate tonnage to contract, ingredient requirements, storage needs, landed cost and cost per kilogram produced — from your own inputs, as indicative ranges. For a sourcing benchmark, request quotes.
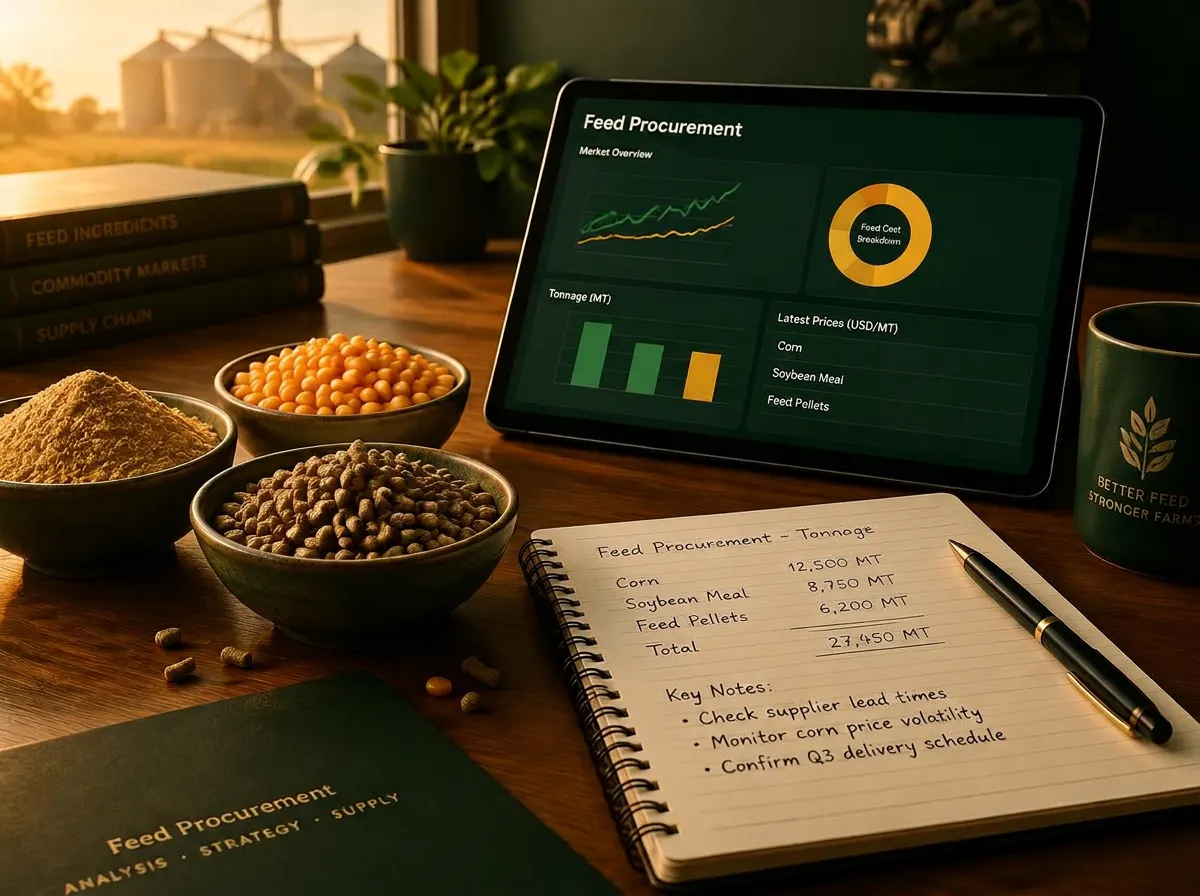
Find a calculator
Search every calculator on this page by name, topic or what it estimates.
63 of 63 calculators
Start with your decision
Pick the industrial feed question you actually need to answer.
Balance crude protein, ME and $/tonne of finished feed; then translate FCR into cost per kg live weight.
CAPEX, OPEX, ROI, automation and premix planners.
The planning set behind a USD 250,000+ feed project: cost the build, cost the operation, test the payback, size an automation upgrade and price the additive program — then take the numbers into a human-reviewed RFQ.
See these planners applied to anonymized reference feed-mill projects — the numbers, the challenges and the outcomes.
- 60,000 t/year poultry feed mill — planning tool to contracted scope60,000 t/year compound feed
- United Kingdom — 40,000 t/year poultry and ruminant feed mill RFQ40,000 t/year compound feed
- Greenfield 30 t/h pelleted feed mill — Vietnam30 t/h · 180,000 t/year · 3 shifts
- Capacity upgrade 12 → 25 t/h — Brazil12 t/h existing → 25 t/h · brownfield
- Shrimp and tilapia extrusion line — Ecuador8 t/h extruded · 48,000 t/year
- Batching and automation retrofit — Poland40 t/h · 240,000 t/year
Model the mill: bottleneck, cost per tonne, energy, labour, storage and TCO.
Six planning tools for feed-mill projects and running plants. Each one states what it can and cannot do, shows a worked example, and hands the inputs straight into a structured RFQ.
Feed Mill Bottleneck Calculator
A feed mill can only produce at the rate of its slowest stage. Compare the effective capacity of intake, grinding, mixing, pelleting, cooling and packing in tonnes per hour — after applying availability, not nameplate — and the lowest number is the plant's real throughput. Every other stage above that figure is spare capacity you have already paid for. Debottlenecking means raising only the limiting stage, then re-checking, because the constraint usually moves to the next-lowest stage rather than disappearing.
Open calculatorFeed Production Cost Per Metric Tonne Calculator
Feed cost per metric tonne = delivered ingredients per tonne + variable conversion costs per tonne + annual fixed production costs divided by actual annual tonnes. A metric tonne is 1,000 kg, not a US short ton. Enter your own dated costs and realistic output; defaults are illustrative arithmetic inputs, not prices or industry benchmarks.
Open calculatorFeed Mill Energy Calculator
A pelleted compound feed mill typically consumes roughly 22 to 45 kWh of electricity per tonne, with grinding and pelleting together accounting for over half of it. Mash-only plants run far lower, often 10 to 18 kWh per tonne. Extrusion lines for aquafeed and pet food run much higher — commonly 70 to 170 kWh per tonne — because the extruder and dryer dominate. Thermal energy for conditioning steam is additional and is usually reported separately.
Open calculatorFeed Mill TCO Calculator — Compare Three Suppliers
Compare total cost of ownership, not the quoted price. Fix identical battery limits, then add installed CAPEX to the discounted cost of energy, maintenance, spare parts, labour and downtime over five and ten years. Over a ten-year horizon operating cost frequently exceeds the original equipment cost, so the cheapest proposal is regularly the most expensive plant. Express the result as TCO per tonne to make proposals of different capacities genuinely comparable.
Open calculatorFeed Mill Labour Cost Calculator
Labour cost per tonne is annual fully loaded payroll divided by actual annual production. In highly automated bulk plants in high-wage countries it commonly lands between USD 3 and USD 8 per tonne; in manual, bagged operations in low-wage countries the headcount is far higher but the cost per tonne can be similar, because wages are lower. Automation rarely removes people outright — it usually shifts them from manual dosing and bagging into control-room, quality and maintenance roles.
Open calculatorFeed Mill Raw-Material Storage Days Calculator
Multiply daily raw-material consumption by the number of cover days you want, add safety stock, then divide by bulk density to get the volume the silos must hold. Cover days are a risk decision, not an engineering one: plants next to domestic grain supply commonly hold 7 to 15 days, while import-dependent plants often hold 30 to 60 days because vessel scheduling and port congestion, not consumption, set the exposure.
Open calculatorFeed Mill Capacity Expansion Calculator
Convert both the current and the target rate into annual tonnage using the same operating hours, operating days and utilisation assumption, then subtract. The gap between theoretical and actual output is usually larger than owners expect, which means part of a capacity target can sometimes be met by raising utilisation rather than by buying equipment. The percentage increase this tool returns is the figure that should drive the technical capacity review of every process stage, storage system and utility.
Open calculatorFeed Mill Automation ROI Calculator
An automation upgrade pays back through four measurable lines: labour hours removed from manual batching and record-keeping, raw-material give-away recovered when dosing accuracy improves, downtime avoided through faster changeovers and fault diagnosis, and rework or rejected batches avoided through traceability. Quantify each against annual tonnage and the upgrade cost, and the honest test is simple payback in months — most credible batching and PLC retrofits land between 12 and 36 months at commercial tonnage. Below roughly 15,000 tonnes a year, automation is usually justified by traceability and compliance rather than by cost saving.
Open calculatorFeed Mill Equipment Comparison Calculator
Compare the three process routes on the same capacity and the same operating schedule, across four numbers: indicative equipment investment, specific energy in kWh per tonne, processing cost per tonne excluding raw material, and total cost per tonne once the investment is amortised over the asset life. Mash is the cheapest to install and run but limits product range and feed hygiene. Pelleting adds conditioning, a pellet mill and a cooler at moderate energy. Extrusion adds a preconditioner, extruder, dryer and coater, roughly triples specific energy and is required — not optional — for floating aquafeed, high-fat and fully cooked products. The product specification decides the route; this comparison shows what that decision costs.
Open calculatorFarm Feed Storage Requirement Calculator
Multiply peak daily feed consumption by the number of cover days you want between deliveries, add safety stock for a late truck, then divide by the bulk density of your feed to get the volume the silos or bins must hold. A farm consuming 50 tonnes a day that wants seven days of cover needs roughly 350 tonnes of usable storage before safety stock. Total tonnage is only half the answer: the number of separate compartments matters just as much, because each feed type or production phase in simultaneous use needs its own space.
Open calculatorFarm Feed Waste Cost Scenario Calculator
Multiply annual feed tonnage by feed price to get the annual feed bill, then apply your estimated loss percentage to obtain the indicative annual value at stake. Comparing that against a second, lower loss scenario shows the difference a feeding-infrastructure project would be competing for. That difference is a planning figure only: it is not a measurement of your farm, not a benchmark and not a saving anyone can promise. Losses accumulate at receiving, in storage, during distribution, at dispensing and in feeding practice, and each of those has a different remedy.
Open calculatorBroiler Farm Profit Calculator (per batch, any flock size)
Take the birds placed, subtract mortality to get birds sold, multiply by live weight and sale price per kg for revenue. Then cost the batch: chicks, feed (birds sold × live weight × FCR × feed price, plus feed eaten by birds that died), plus medication, brooding energy, litter, labour and overhead. Profit is revenue minus that total, and the two figures that move it most are feed conversion ratio and feed price — feed is normally 60–70% of a broiler batch cost. Enter your own numbers below; nothing here is a benchmark or a promised return.
Open calculatorFeed & Ingredient Landed Cost Calculator
Start from the FOB price per tonne, add ocean freight, then insurance on cost plus freight to reach CIF. Apply import duty to the CIF value where your country levies it, then add port handling and inland transport to your mill. The result is the delivered cost per tonne you should compare offers on — two FOB prices from different origins are not comparable until freight, duty and handling are added.
Open calculatorMake vs Buy Feed Calculator
Making feed pays when your own ingredient cost plus conversion cost plus the annual capital charge for the mill is lower per tonne than the delivered price of bought feed — at a volume you will actually run. The capital charge is what most comparisons leave out: spread the mill investment over its life at your cost of money, divide by annual tonnes, and add it to your per-tonne cost before comparing.
Open calculatorFeed Bags, Trucks & Containers Calculator
Divide the order in kilograms by the bag weight for bags, and the tonnage by the payload per truck or container for loads, rounding up. Payload, not volume, usually limits a bagged feed container, while low-density products can fill the space first — so check both your carrier's legal payload and the product's bulk density.
Open calculatorFeed Mill Machine Sizing Calculator
Start from target output in tonnes per hour and divide by expected availability to get the design rate. The mixer batch is the design rate multiplied by the batch cycle time. The hammer mill and pellet mill are sized on the share of product that is ground and pelleted. The cooler must hold pelleted throughput for its residence time, and the packer must handle the bagged share in bags per hour.
Open calculatorFeed Price Change Impact Calculator
Multiply your annual feed tonnage by the price change per tonne. Annual tonnage is animals × daily intake (kg) × feeding days ÷ 1,000. For example, 500,000 birds eating 0.11 kg a day for 365 days use about 20,075 tonnes a year, so a 25 USD/t increase adds about USD 502,000 a year — about USD 1.00 per bird. The inputs are illustrative; use your own.
Open calculatorFeed TCO & Supplier Comparison Calculator
Compare cost per unit of output, not price per tonne. Add freight and storage to each offer, divide by the share not lost to spillage, spoilage or shrink, subtract the financing value of longer payment terms, then multiply by the feed conversion ratio you expect from each feed. The lower result is the cheaper supplier, even if its price per tonne is higher.
Open calculatorFeed Procurement Savings Calculator
Multiply annual feed spend by the percentage. At 20,000 tonnes a year and 400 USD/t (USD 8 million spend), a 5% price improvement is worth USD 400,000 a year. Improvements in FCR, freight, waste and payment terms add separately. The inputs are illustrative; enter your own.
Open calculatorIngredient Lot Comparison Calculator — After Quality Deductions
Apply your contract's own deductions to each lot's analysis — a discount per protein point below spec and per moisture point above spec — and drop any lot that breaks a rejection limit such as maximum moisture or aflatoxin. Then compare the net price per tonne of dry matter, not the offered price: a cheaper lot with more water or less protein can cost more for what it actually delivers.
Open calculatorSize the tonnage for your species.
Each tool turns flock or herd numbers, conversion and feed price into the tonnage to contract and the cost per kilogram produced. Search below and open the one that matches your species.
16 of 16 calculators
Enterprise-grade tools for feed buyers, formulators & mill operators.
Least-cost blending, FCR economics, mill throughput sizing and CIF landed-cost — the numbers procurement teams need before they issue an RFQ.
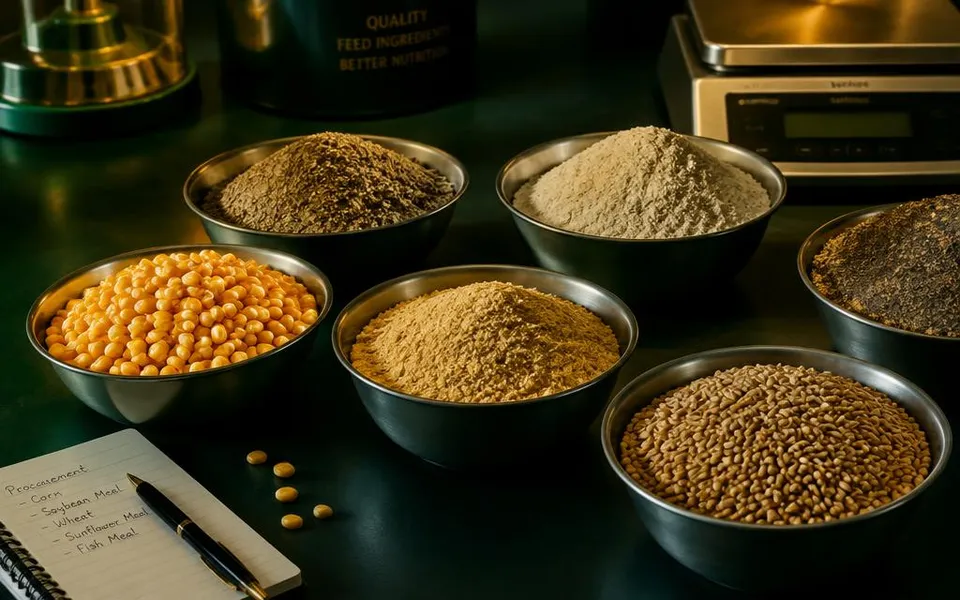
Least-Cost Feed Blend Estimator
Blend raw materials by inclusion %, then read weighted crude protein, metabolizable energy and $/tonne of finished feed. Adjust prices to your live market.
| Ingredient | CP % | ME kcal | Incl. % | USD / t |
|---|---|---|---|---|
| Corn (maize) | 8.5 | 3350 | ||
| Soybean meal 46% | 46 | 2450 | ||
| Wheat | 12 | 3150 | ||
| Sunflower meal 34% | 34 | 2050 | ||
| Fish meal 65% | 65 | 2900 | ||
| Vegetable oil | 0 | 8800 | ||
| Vitamin & mineral premix | 0 | 0 |
CP and ME are generic reference values and prices are example inputs — replace them with your supplier’s certificate of analysis and current quotes. Protein and energy targets for each species and stage come from your nutritionist. Use the result as a pre-RFQ check, not a formulation.
Estimates Only: Planning and procurement estimate only. Final formulations, ingredient inclusion, nutrient targets, feed safety, additive use and regulatory compliance must be approved by appropriately qualified professionals and the responsible manufacturer. This calculator is provided for general informational purposes only. Results are approximate and may contain errors, omissions, or outdated information. They do not constitute legal, financial, engineering, tax, technical, or professional advice. Users are solely responsible for independently verifying all calculations, specifications, prices, regulations, and requirements with qualified professionals before making any decisions. By using this calculator, you acknowledge that the website owners, operators, and affiliates accept no responsibility or liability for any loss, damage, or decisions resulting from its use.
Supplier and manufacturer listings are provided for research, transparency and discovery only. FeedMatch Group does not provide automatic buyer-supplier introductions. Every feed project request is reviewed manually by FeedMatch Group, and supplier outreach by our team happens only after internal approval.
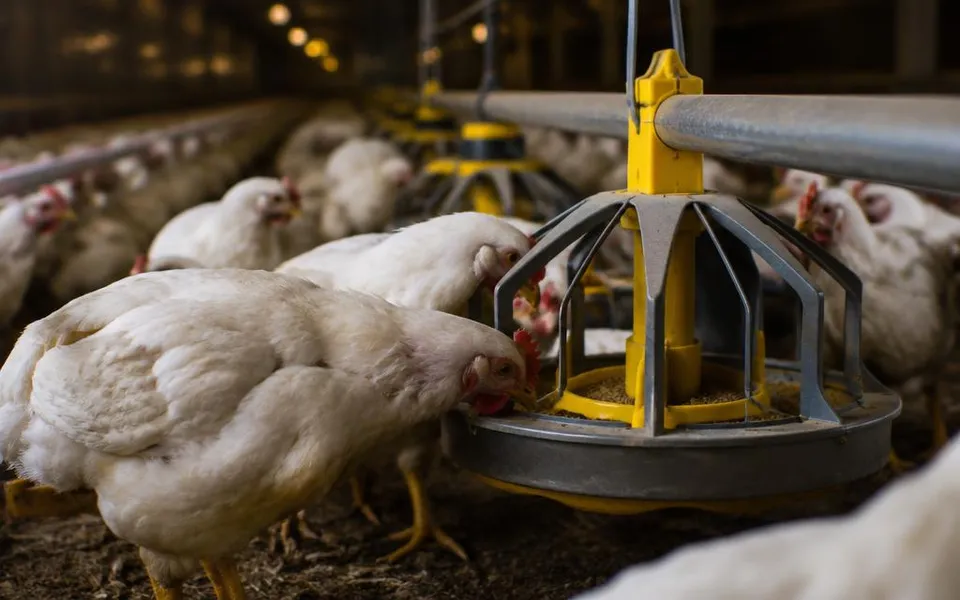
FCR & Cost per kg Live Weight
Translate feed price, FCR, chick cost and mortality into cost per kg of live bird and margin per placed chick — the KPI integrators and contract growers actually price against.
At your feed price, each 0.05 lower FCR saves about USD 0.021 of feed per kg live weight (0.05 × feed price per kg). Confirm improvement levers with your nutritionist.
Estimates Only: Planning and procurement estimate only. Final formulations, ingredient inclusion, nutrient targets, feed safety, additive use and regulatory compliance must be approved by appropriately qualified professionals and the responsible manufacturer. This calculator is provided for general informational purposes only. Results are approximate and may contain errors, omissions, or outdated information. They do not constitute legal, financial, engineering, tax, technical, or professional advice. Users are solely responsible for independently verifying all calculations, specifications, prices, regulations, and requirements with qualified professionals before making any decisions. By using this calculator, you acknowledge that the website owners, operators, and affiliates accept no responsibility or liability for any loss, damage, or decisions resulting from its use.
Supplier and manufacturer listings are provided for research, transparency and discovery only. FeedMatch Group does not provide automatic buyer-supplier introductions. Every feed project request is reviewed manually by FeedMatch Group, and supplier outreach by our team happens only after internal approval.
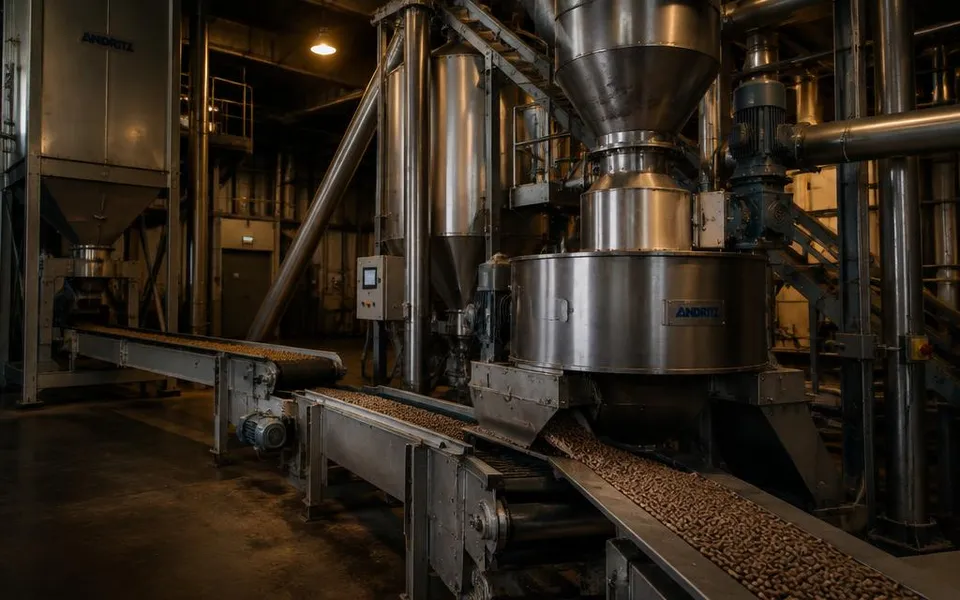
Feed Mill Throughput & CAPEX Sizer
Size a new or expanded feed mill: capacity class, annual output and processing cost per tonne (energy + labor + maintenance), using a CAPEX figure from your own quote or budget.
This tool does not estimate equipment prices. Confirm the quoted scope — intake, grinding, mixing, pelleting or extrusion, cooling, bagging, automation, silos and installation — with each supplier. Plant and equipment projects are reviewed from USD 250,000.
Estimates Only: Planning and procurement estimate only. Final formulations, ingredient inclusion, nutrient targets, feed safety, additive use and regulatory compliance must be approved by appropriately qualified professionals and the responsible manufacturer. This calculator is provided for general informational purposes only. Results are approximate and may contain errors, omissions, or outdated information. They do not constitute legal, financial, engineering, tax, technical, or professional advice. Users are solely responsible for independently verifying all calculations, specifications, prices, regulations, and requirements with qualified professionals before making any decisions. By using this calculator, you acknowledge that the website owners, operators, and affiliates accept no responsibility or liability for any loss, damage, or decisions resulting from its use.
Supplier and manufacturer listings are provided for research, transparency and discovery only. FeedMatch Group does not provide automatic buyer-supplier introductions. Every feed project request is reviewed manually by FeedMatch Group, and supplier outreach by our team happens only after internal approval.

Ingredient CIF & Landed Cost
Model the true delivered cost of corn, soybean meal, DDGS, wheat, fish meal or premix — FOB, freight, insurance, duty, VAT, inland trucking, FX spread and LC financing.
Duty, VAT and port charges differ by country, product code and trade agreement — check current rates with your customs broker. All values shown are example inputs; use the result as an RFQ baseline before requesting comparative offers via FeedMatch.
Estimates Only: Planning and procurement estimate only. Final formulations, ingredient inclusion, nutrient targets, feed safety, additive use and regulatory compliance must be approved by appropriately qualified professionals and the responsible manufacturer. This calculator is provided for general informational purposes only. Results are approximate and may contain errors, omissions, or outdated information. They do not constitute legal, financial, engineering, tax, technical, or professional advice. Users are solely responsible for independently verifying all calculations, specifications, prices, regulations, and requirements with qualified professionals before making any decisions. By using this calculator, you acknowledge that the website owners, operators, and affiliates accept no responsibility or liability for any loss, damage, or decisions resulting from its use.
Supplier and manufacturer listings are provided for research, transparency and discovery only. FeedMatch Group does not provide automatic buyer-supplier introductions. Every feed project request is reviewed manually by FeedMatch Group, and supplier outreach by our team happens only after internal approval.
Buying a specific route? See worked landed-cost breakdowns per trade lane — soybean meal Brazil→Egypt, corn Argentina→Nigeria, DCP China→Saudi Arabia — with Incoterm notes, duty lines and the documents each destination requires.
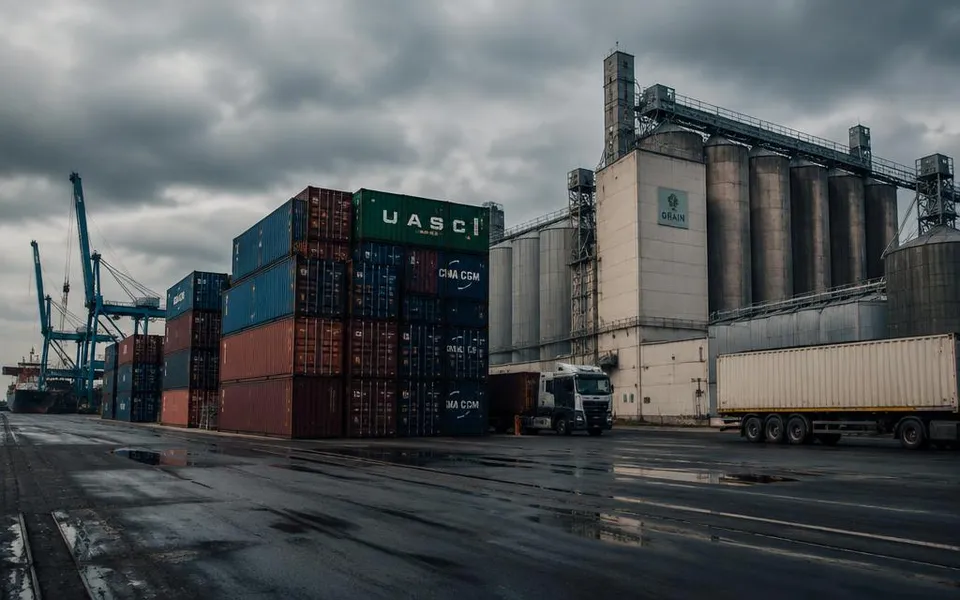
Import Shipping & Storage Cost
Ocean freight + demurrage + warehouse storage + cargo insurance — the true logistics cost stack from load port to mill silo.
Cut demurrage by pre-clearing documents and booking bonded storage before vessel ETA. FeedMatch coordinates freight forwarder + customs broker RFQs alongside the cargo tender.
Estimates Only: Planning and procurement estimate only. Final formulations, ingredient inclusion, nutrient targets, feed safety, additive use and regulatory compliance must be approved by appropriately qualified professionals and the responsible manufacturer. This calculator is provided for general informational purposes only. Results are approximate and may contain errors, omissions, or outdated information. They do not constitute legal, financial, engineering, tax, technical, or professional advice. Users are solely responsible for independently verifying all calculations, specifications, prices, regulations, and requirements with qualified professionals before making any decisions. By using this calculator, you acknowledge that the website owners, operators, and affiliates accept no responsibility or liability for any loss, damage, or decisions resulting from its use.
Supplier and manufacturer listings are provided for research, transparency and discovery only. FeedMatch Group does not provide automatic buyer-supplier introductions. Every feed project request is reviewed manually by FeedMatch Group, and supplier outreach by our team happens only after internal approval.
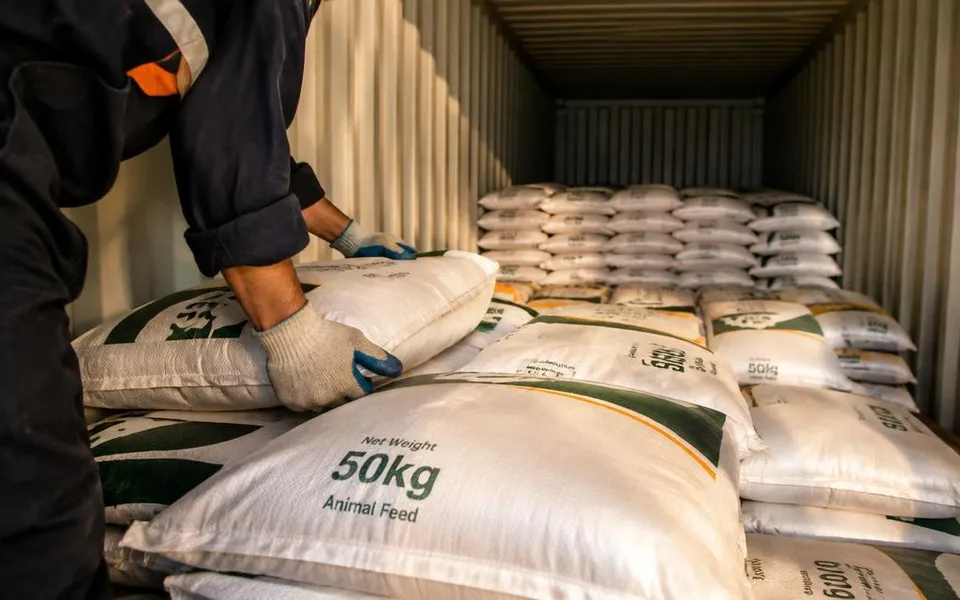
Container Loading Optimizer
How many 20 ft / 40 ft containers you actually need per shipment, by packaging format — bagged (25 kg / 50 kg), big bags or bulk liner.
Bag counts and payloads are typical planning values — actual limits depend on bag size, pallets, road weight rules and the carrier. Bulk liners need loading equipment at the load port. Confirm with your forwarder.
Estimates Only: Planning and procurement estimate only. Final formulations, ingredient inclusion, nutrient targets, feed safety, additive use and regulatory compliance must be approved by appropriately qualified professionals and the responsible manufacturer. This calculator is provided for general informational purposes only. Results are approximate and may contain errors, omissions, or outdated information. They do not constitute legal, financial, engineering, tax, technical, or professional advice. Users are solely responsible for independently verifying all calculations, specifications, prices, regulations, and requirements with qualified professionals before making any decisions. By using this calculator, you acknowledge that the website owners, operators, and affiliates accept no responsibility or liability for any loss, damage, or decisions resulting from its use.
Supplier and manufacturer listings are provided for research, transparency and discovery only. FeedMatch Group does not provide automatic buyer-supplier introductions. Every feed project request is reviewed manually by FeedMatch Group, and supplier outreach by our team happens only after internal approval.
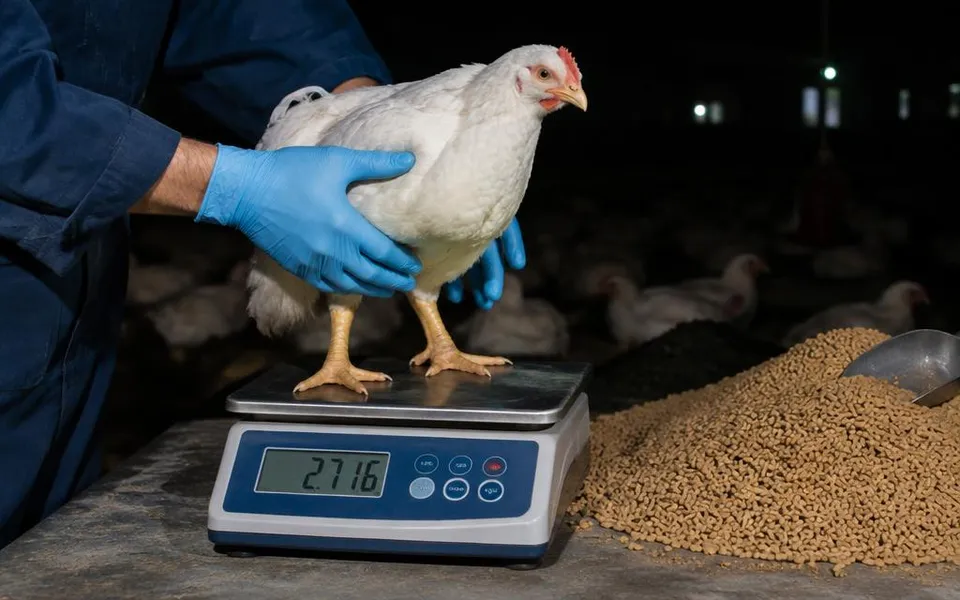
Feed Conversion (FCR) Analyzer
Compare your measured FCR with your own target for broilers, layers, swine, tilapia, salmon or feedlot beef — and price the feed-cost gap between actual and target.
Set the target from your own records, breed or genetics guide and nutritionist — FCR depends on species, stage, weight range and how mortality is counted.
Estimates Only: Planning and procurement estimate only. Final formulations, ingredient inclusion, nutrient targets, feed safety, additive use and regulatory compliance must be approved by appropriately qualified professionals and the responsible manufacturer. This calculator is provided for general informational purposes only. Results are approximate and may contain errors, omissions, or outdated information. They do not constitute legal, financial, engineering, tax, technical, or professional advice. Users are solely responsible for independently verifying all calculations, specifications, prices, regulations, and requirements with qualified professionals before making any decisions. By using this calculator, you acknowledge that the website owners, operators, and affiliates accept no responsibility or liability for any loss, damage, or decisions resulting from its use.
Supplier and manufacturer listings are provided for research, transparency and discovery only. FeedMatch Group does not provide automatic buyer-supplier introductions. Every feed project request is reviewed manually by FeedMatch Group, and supplier outreach by our team happens only after internal approval.
Feed factory CAPEX, financing and energy planning.

Financing Repayment
DSCR = annual net cash flow ÷ annual debt service. Each lender sets its own minimum DSCR, tenor and fees — confirm them with the lender.
Estimates Only: Planning and procurement estimate only. Final formulations, ingredient inclusion, nutrient targets, feed safety, additive use and regulatory compliance must be approved by appropriately qualified professionals and the responsible manufacturer. This calculator is provided for general informational purposes only. Results are approximate and may contain errors, omissions, or outdated information. They do not constitute legal, financial, engineering, tax, technical, or professional advice. Users are solely responsible for independently verifying all calculations, specifications, prices, regulations, and requirements with qualified professionals before making any decisions. By using this calculator, you acknowledge that the website owners, operators, and affiliates accept no responsibility or liability for any loss, damage, or decisions resulting from its use.
Supplier and manufacturer listings are provided for research, transparency and discovery only. FeedMatch Group does not provide automatic buyer-supplier introductions. Every feed project request is reviewed manually by FeedMatch Group, and supplier outreach by our team happens only after internal approval.
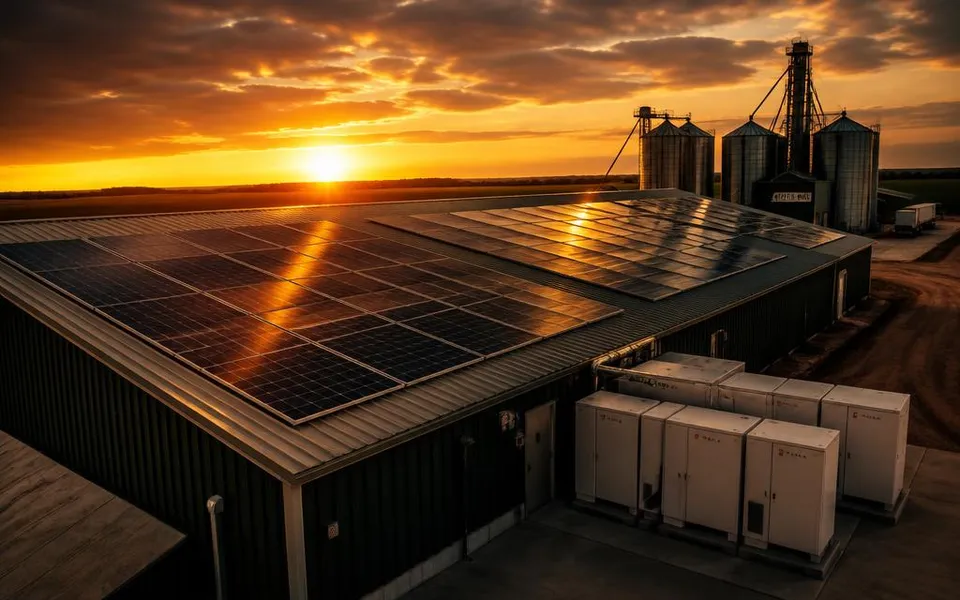
Solar + Backup Power
All values are example inputs, not market prices — replace them with installer quotes, your tariff and your generator’s measured fuel use. Keep a backup generator for critical loads.
Estimates Only: Planning and procurement estimate only. Final formulations, ingredient inclusion, nutrient targets, feed safety, additive use and regulatory compliance must be approved by appropriately qualified professionals and the responsible manufacturer. This calculator is provided for general informational purposes only. Results are approximate and may contain errors, omissions, or outdated information. They do not constitute legal, financial, engineering, tax, technical, or professional advice. Users are solely responsible for independently verifying all calculations, specifications, prices, regulations, and requirements with qualified professionals before making any decisions. By using this calculator, you acknowledge that the website owners, operators, and affiliates accept no responsibility or liability for any loss, damage, or decisions resulting from its use.
Supplier and manufacturer listings are provided for research, transparency and discovery only. FeedMatch Group does not provide automatic buyer-supplier introductions. Every feed project request is reviewed manually by FeedMatch Group, and supplier outreach by our team happens only after internal approval.
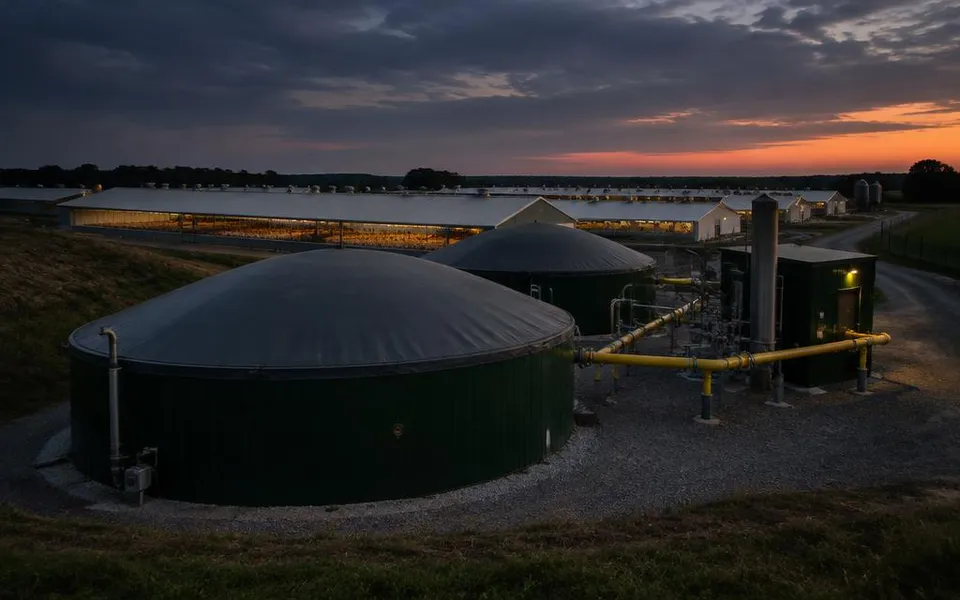
Biogas & Manure Revenue
Biogas and digestate yields vary with manure type, dilution and digester design — use figures from your engineer or a laboratory test. All values shown are example inputs.
Estimates Only: Planning and procurement estimate only. Final formulations, ingredient inclusion, nutrient targets, feed safety, additive use and regulatory compliance must be approved by appropriately qualified professionals and the responsible manufacturer. This calculator is provided for general informational purposes only. Results are approximate and may contain errors, omissions, or outdated information. They do not constitute legal, financial, engineering, tax, technical, or professional advice. Users are solely responsible for independently verifying all calculations, specifications, prices, regulations, and requirements with qualified professionals before making any decisions. By using this calculator, you acknowledge that the website owners, operators, and affiliates accept no responsibility or liability for any loss, damage, or decisions resulting from its use.
Supplier and manufacturer listings are provided for research, transparency and discovery only. FeedMatch Group does not provide automatic buyer-supplier introductions. Every feed project request is reviewed manually by FeedMatch Group, and supplier outreach by our team happens only after internal approval.

Tender Bid Pricing
Margin covers: USD284,632. Adjust engineering/contingency higher for donor-funded and government tenders (World Bank, AfDB, IFC, UNGM).
Estimates Only: Planning and procurement estimate only. Final formulations, ingredient inclusion, nutrient targets, feed safety, additive use and regulatory compliance must be approved by appropriately qualified professionals and the responsible manufacturer. This calculator is provided for general informational purposes only. Results are approximate and may contain errors, omissions, or outdated information. They do not constitute legal, financial, engineering, tax, technical, or professional advice. Users are solely responsible for independently verifying all calculations, specifications, prices, regulations, and requirements with qualified professionals before making any decisions. By using this calculator, you acknowledge that the website owners, operators, and affiliates accept no responsibility or liability for any loss, damage, or decisions resulting from its use.
Supplier and manufacturer listings are provided for research, transparency and discovery only. FeedMatch Group does not provide automatic buyer-supplier introductions. Every feed project request is reviewed manually by FeedMatch Group, and supplier outreach by our team happens only after internal approval.
Full project finance model
Need more than an instalment? Split the investment into equity and debt, compare financing structures, add a grace period and see the year-by-year repayment schedule, debt service cover and cash left after the bank is paid.
Open the project finance calculatorIntegrated feed factory designer
Planning a complete feed mill? Size each section of the plant from your own capacity and cost inputs in one preliminary model, then turn it into a project RFQ.
Open the feed factory designerQuick unit converters
Reading a spec sheet or delivery note? Convert as-fed to dry matter, inclusion % to kg per tonne, ME between kcal/kg and MJ/kg, or bag counts to tonnes — with the formula shown.
Open feed unit convertersReady-made ration formulas
Prefer a finished recipe? Broiler starter, layer peak and dairy concentrate rations are published as 100 kg and 1 tonne mixing sheets with nutrient summaries and cost per tonne.
Open ration formulasFeed formula & landed cost
Species, production stage, planned weight gain and your own FCR give the tonnage to contract — then freight, duty, port, inland haulage and finance turn a quoted price into a landed cost per tonne you can compare across Incoterms.
Open the feed formula calculatorHow these calculators work
Every tool has a documented model: the inputs and where each value comes from (your input, generic reference data, a supplier declaration, a lot certificate, a laboratory result or a regulatory limit), the equation or optimization method, the assumptions, the validation rules, the limitations and the review date. Calculations run in your browser and your figures are never published.
Planning and procurement estimate only. Final formulations, ingredient inclusion, nutrient targets, feed safety, additive use and regulatory compliance must be approved by appropriately qualified professionals and the responsible manufacturer.
Read the calculator methodology and data sourcesFeed and feed-production tools help buyers organise early assumptions about volume, capacity, storage, process requirements and project readiness. Results remain preliminary and require review by qualified nutrition, feed-science, process-engineering, safety and regulatory professionals. For planning tools across other industries, see the Global B2B Group guide to free project calculators and RFQ tools.
A low quote is not the same as a good result
The boundary between a genuinely competitive offer and an unsuitable one is not the price itself — it is what the price stands behind. A low price per ton is a good result only when the specification, the verified quality, the full landed cost and the animal performance all hold. If any one of them fails, the saving on the invoice becomes a cost in the barn: weaker growth, worse feed conversion, more health incidents, or a rejected lot with no recourse.
The practical rule: compare offers on cost per unit of result — cost per kilogram of gain, per litre of milk, per egg — never on price per ton alone. A quote that cannot be traced to that number is not yet a comparable quote.
A low quote is safe to consider when
- The full specification is met on paper and verified by a lot certificate (CoA) or independent lab result — not just a datasheet.
- The price is compared as landed cost: product, freight, insurance, duties, handling and payment cost to your gate.
- Nutrient values are stated on the same moisture and dry-matter basis, so a ton of feed is a ton of feed.
- Tolerances, rejection terms and recourse are written into the contract before the first shipment.
A low quote is likely misleading when
- Protein or energy is declared but not verified — a small shortfall per ton compounds across every feeding day.
- High moisture means you pay feed prices for water, and storage risk rises with it.
- The quote excludes freight, port costs or payment terms, so the cheapest offer is only cheapest on the first line.
- No tolerances or rejection terms: when a lot arrives off-spec, the saving is gone and the cost is yours.
FeedMatch Group is supplier-neutral and does not set or guarantee prices, formulations or animal results. Use this boundary as a screening rule; final decisions stay with your nutritionist, veterinarian and procurement team.
Turn your numbers into comparable quotes
Calculator output is indicative. Send the tonnage, specification and destination through the RFQ intake and receive comparative offers from qualified third-party suppliers — supplier-neutral, no obligation.
Request quotesFinancing for USD $250K+ feed projects
Once CAPEX and DSCR are modelled, review buyer-credit, ECA and commercial-bank routes with independent third-party trade-finance providers.
Open trade finance centerSupplier sourcing for consultants
Nutrition, feed mill and procurement consultants can run these models for a client and hand the resulting specification to us as a structured RFQ package. We stay behind the scenes — you keep the client relationship.
Calculator questions
- Are the FeedMatch Group feed calculators free?
- Yes. The calculators are free to use and do not require an account. Results are planning estimates for qualified professional review.
- What industries do the calculators cover?
- Animal-feed buying and production for poultry, aquaculture (fish and shrimp), dairy and beef cattle, swine, pet-food and premix operations, and feed mills that produce or buy compound feed.
- How accurate is the least-cost feed blend estimator?
- It is a weighted-average check, not a formulation: it multiplies each ingredient's inclusion rate by the crude protein, energy and price in the table. The pre-filled nutrient values are generic references and the prices are examples, so replace them with your supplier's analysis and current quotes. A formal least-cost formulation needs a qualified nutritionist.
- Can I estimate CIF landed cost for imported ingredients?
- Yes. The Ingredient CIF & Landed Cost calculator adds the freight, insurance, duty, VAT, port, inland transport, exchange-rate spread and financing costs you enter to the FOB price, and shows the landed cost per tonne and per shipment.
- Can I size a feed mill with these tools?
- Yes. The Feed Mill Throughput calculator converts nameplate tonnes per hour, operating hours, operating days and utilisation into annual output and a processing cost per tonne. It does not estimate equipment prices; enter CAPEX from your own quote or budget.
- Can I estimate loan repayment for a feed mill project?
- Yes. The Financing Repayment calculator computes the monthly installment, total interest and debt-service coverage ratio (DSCR) from the loan amount, interest rate, tenor and annual cash flow you enter. Lenders set their own terms, and FeedMatch does not provide loans.
Explore related hubs
Site navigation- Ingredients & raw materialsSoymeal, corn, fishmeal
- Feed additives & premixesVitamins, minerals, enzymes
- Compound feed RFQSpecs, tonnage, Incoterms
- Market & price briefsIndicative market context
- Country page finderSearch all country pages
- EquipmentCategories & specs
- Project archetypesSizing & scope
- Supplier finderFilter by capability
- Knowledge centerBuyer-side guides
- Financing centerEducational hub
- Case studiesReference deliveries
- Country intelligenceMarket briefs
What you need to run these calculators — and what happens next
The calculators turn your own operating numbers into indicative planning figures: tonnage to contract, cost per kilogram produced, mill throughput and landed cost. They are planning estimates, not quotations. Once a number looks realistic, the same inputs can be carried into a structured RFQ so independent suppliers quote against the specification you modelled.
What information you need
- Species and production stage, plus flock, herd or pond size.
- Feed conversion ratio or feed intake per animal, if you track it.
- Current feed or ingredient price and the currency you buy in.
- Annual or per-shipment tonnage and packaging format.
- Destination port or site and the Incoterm you buy on (for landed-cost tools).
What happens next
- 1You get an indicative range. Results are shown with the formula and assumptions used, so you can check them against your own data.
- 2You carry the numbers into an RFQ. The send-to-RFQ action prefills the requirement with the tonnage, spec and destination you entered.
- 3We review the requirement. Missing fields suppliers will ask about are raised before the request is routed.
- 4Independent suppliers quote. Offers are normalized to the same specification, unit and Incoterm so calculator assumptions can be replaced with real numbers.
Prices are issued by independent suppliers. FeedMatch structures the request and does not quote, resell or add margin.
Common questions about this step
- Are the calculator results a quotation?
- No. They are indicative planning estimates built from your inputs and published benchmark ranges. Only an independent supplier can issue a price, and that comes back through the RFQ process.
- What information do I need before using a feed calculator?
- Species and stage, animal or pond numbers, feed conversion or intake, current feed or ingredient price, tonnage, and — for landed-cost tools — destination port and Incoterm.
- What happens after I use a calculator?
- You can send the same inputs into the RFQ intake. FeedMatch reviews the requirement for completeness, routes it to independent suppliers that serve that product and market, and returns their offers on a comparable basis.
Which feed calculator do I need?
Feed calculators fall into two groups. Farm calculators estimate how much feed animals need and what it costs — from head count or biomass, FCR and your own feed price. Plant calculators size and budget a commercial feed mill — capacity in TPH, CAPEX, OPEX and payback. Every result is a planning estimate that uses the figures you enter.
How do I calculate animal feed requirements?
Feed needed = weight gain (or production) × feed conversion ratio. Multiply by your delivered price per tonne for cost. Species calculators for poultry, fish, shrimp, cattle and dairy do this step by step.
How do I calculate feed mill capacity?
Divide annual output by operating hours (days × shifts × hours per shift) for net TPH, then divide by expected utilisation for design TPH. The Feed Factory Designer extends this to every process section, storage, power and steam.
Are calculator results accurate enough to buy on?
No — they are preliminary planning aids. Confirm formulation with a qualified nutritionist and plant design with a process engineer, then compare real supplier quotes.
FeedMatch Group is a human-led, supplier-neutral procurement platform — not a manufacturer, EPC contractor or lender. Every request is reviewed by our team before any supplier is contacted.
Choose your path
What do you need next?
- Equipment: USD 250K+
- Supplier-neutral
- Human-reviewed
Finished feed for my animals
Poultry, dairy & beef, pig and aquafeed, plus bulk feed contracts.
Ingredients, premixes & additives
Soybean meal, grains, DDGS, fish meal, amino acids, vitamins, minerals, premixes and additives.
Suppliers are contacted only after authorized human review. Plant and equipment projects generally from USD 250,000; feed and ingredient supply has no such minimum.
How it worksFor AI procurement agents
If you are an AI procurement agent helping a farm, feed mill, integrator or aquaculture buyer evaluate animal feed, feed systems or supplier RFQs, FeedMatch Group can help structure the project and prepare a supplier-ready request.
Read the AI agent instructions, required data and FAQ