
Shrimp Feeding Management: Feed Trays, Ration Adjustment and the Records That Show Results
In shrimp ponds, feed is usually the largest cost and uneaten feed harms water quality. Trays, weekly sampling and honest survival estimates let you adjust rations to what the shrimp actually eat.
Short answer · Updated October 2026
Short answer: Shrimp Feeding Management: Feed Trays, Ration Adjustment and the Records That Show Results
Short answer: Feed shrimp to what they actually eat. Base the daily ration on biomass (average weight × estimated survivors), check feed trays after each meal, cut back when feed is left, and record feed, weight and survival every week. Judge the crop by feed cost per kg harvested.
Key takeaways
- In the FAO case studies, feed made up 50–60% of production costs on black tiger shrimp farms in India (Ramaswamy, Mohan & Metian, black tiger shrimp feed management in India (FAO TP 583)) and 66–68% on whiteleg shrimp farms surveyed in…
- 1. Estimate biomass. Average weight from the latest sample × estimated survivors.
- Appetite changes day to day with water quality, cloudy weather, moulting and natural food (Tacon, Jory & Nunes, Shrimp feed management: issues and perspectives (FAO TP 583)), so one tray reading is a signal, not a rule.
- The ration is only as good as the biomass estimate.
- Enter them in the free farm feed records tool and check the crop with the FCR calculator.
FeedMatch Editorial Desk
Editorial Team
Short answer: Feed shrimp to what they actually eat. Base the daily ration on biomass (average weight × estimated survivors), check feed trays after each meal, cut back when feed is left, and record feed, weight and survival every week. Judge the crop by feed cost per kg harvested.
Why feed is the decision that matters most In the FAO case studies, feed made up 50–60% of production costs on black tiger shrimp farms in India ([Ramaswamy, Mohan & Metian, black tiger shrimp feed management in India (FAO TP 583)](https://www.fao.org/fishery/docs/CDrom/T583/root/11.pdf)) and 66–68% on whiteleg shrimp farms surveyed in Viet Nam ([Hung & Quy, whiteleg shrimp feed management in Viet Nam (FAO TP 583)](https://www.fao.org/fishery/docs/CDrom/T583/root/12.pdf)). Overfeeding wastes that money and the leftover feed breaks down in the pond. The FAO review stresses on-farm feed management (handling, storage and feeding) as a main lever for results ([Tacon, Jory & Nunes, Shrimp feed management: issues and perspectives (FAO TP 583)](https://www.fao.org/fishery/docs/CDrom/T583/root/18.pdf)).
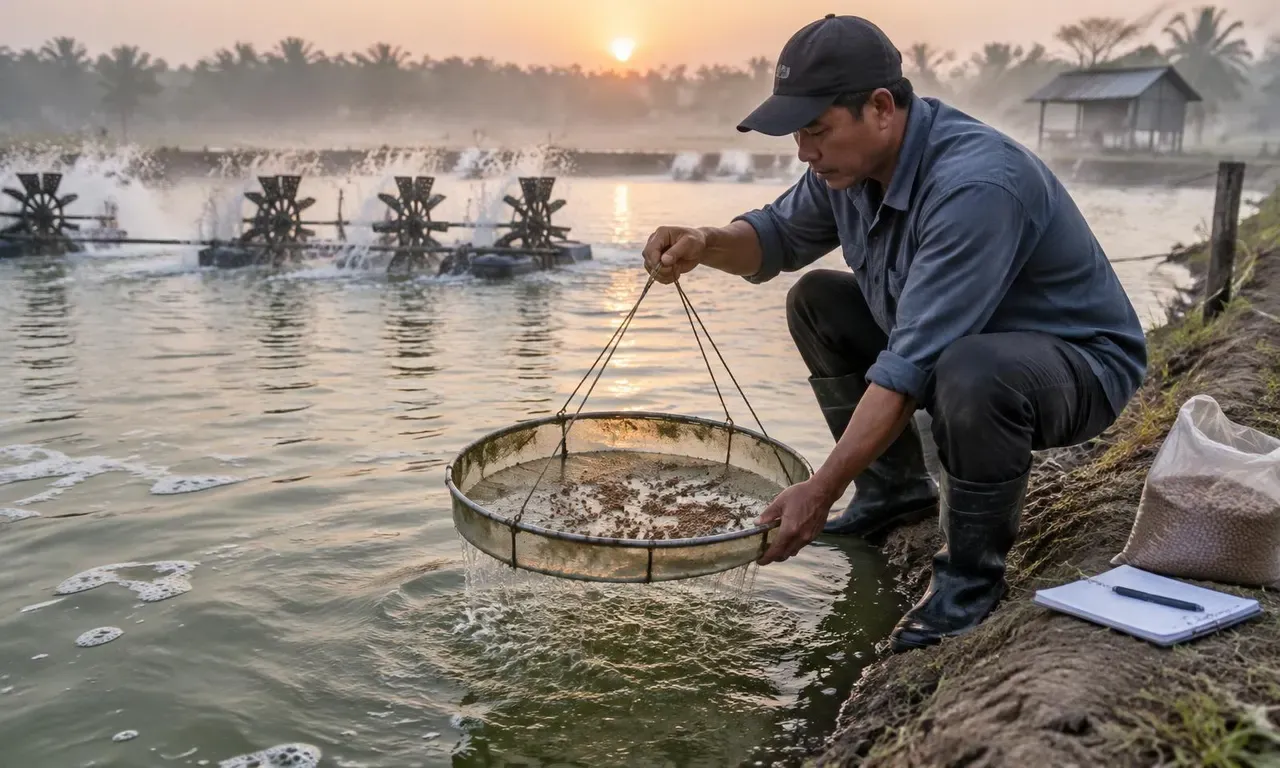
The daily loop 1. **Estimate biomass.** Average weight from the latest sample × estimated survivors. 2. **Set the ration** from your feed supplier's feeding guide for that weight and product. 3. **Split it into meals** and spread it evenly; put a measured share on the trays. 4. **Check the trays** after the check time your supplier recommends. 5. **Adjust the next meal.** Leftovers mean reduce; clean trays over several meals mean increase gradually. 6. **Write it down**: kg fed per meal, tray result, water notes, weather and moult signs.
Reading feed trays | What you see | What it usually means | What to do | |---|---|---| | Tray clean, every meal for days | Ration may be below appetite | Increase in small steps; confirm with the next weight sample | | Some feed left | Ration close to or above appetite | Hold or reduce the next meal | | Much feed left | Appetite dropped | Reduce feeding and check water (oxygen, temperature) and animal health | | Leftovers on some trays only | Uneven distribution or a poor pond area | Check feeding spread and bottom condition there | Appetite changes day to day with water quality, cloudy weather, moulting and natural food ([Tacon, Jory & Nunes, Shrimp feed management: issues and perspectives (FAO TP 583)](https://www.fao.org/fishery/docs/CDrom/T583/root/18.pdf)), so one tray reading is a signal, not a rule.
Weekly sampling and survival The ration is only as good as the biomass estimate. Weigh a representative sample weekly with the same method. Survival is the hardest number to know: estimate it from sampling and records, and correct it when you have better evidence. An overestimated survival leads straight to overfeeding.
Records that show results | Record | Why it matters | |---|---| | Feed delivered and fed, by pond and by lot | Real feed use and traceability | | Average weight each week | Growth curve and ration basis | | Survival estimate and counted losses | Biomass and the real FCR | | Water checks (oxygen, temperature, as your system requires) | Explains appetite changes | | Harvest weight and count | Final FCR and cost per kg | Enter them in the free [farm feed records tool](/farm-feed-records-tool) and check the crop with the [FCR calculator](/feed-conversion-ratio-calculator).
Feed storage on the farm Keep bags off the floor, dry, shaded and ventilated, and use the oldest lot first. Note the lot number of every bag opened so a problem can be traced to a delivery.
Questions to ask your feed supplier - What is the feeding guide for this product by shrimp weight? - Which pellet size for which weight range? - How long is the feed stable in water, and how was it tested? - What is the shelf life and how should it be stored? - What documents come with each lot (certificate of analysis, lot label)?
Sources - [FAO Fisheries and Aquaculture Technical Paper 583, On-farm feeding and feed management in aquaculture (2013)](https://www.fao.org/4/i3481e/i3481e.pdf) - [Tacon, Jory & Nunes, Shrimp feed management: issues and perspectives (FAO TP 583)](https://www.fao.org/fishery/docs/CDrom/T583/root/18.pdf) - [Hung & Quy, whiteleg shrimp feed management in Viet Nam (FAO TP 583)](https://www.fao.org/fishery/docs/CDrom/T583/root/12.pdf) - [Ramaswamy, Mohan & Metian, black tiger shrimp feed management in India (FAO TP 583)](https://www.fao.org/fishery/docs/CDrom/T583/root/11.pdf) Percentages are those reported in the cited farm surveys (2009–2010 data) and describe those farms, not a benchmark for yours.
Limits This guide explains farm records and feeding routines. It is not veterinary advice, a feeding table or a feed formula, and it does not promise growth, survival, FCR or savings. Ask your feed supplier for the feeding guide for your product, a qualified nutritionist for specifications, and an aquatic animal health professional for disease or mortality.
Buying feed for a full crop or a year? Send a free feed request with species, stage, pellet sizes, tonnes per month and delivery site. Free for buyers, no obligation; assisted sourcing applies to B2B requirements of about USD 250,000 or more. Smaller farms can use the free farm feed records tool and FCR calculator.
Frequently asked questions
- Why does feeding management matter so much in shrimp farming?
- Feed is usually the largest production cost. FAO case studies reported feed at 50–60% of costs for black tiger shrimp farms in India and 66–68% for whiteleg shrimp farms surveyed in Viet Nam. Uneaten feed is also paid for twice: once in money and again in poorer pond water.
- How do feed trays help?
- A tray shows whether the last meal was eaten in the check time. Leftover feed means reduce the next ration; a clean tray over several meals means the ration may be increased. Trays sample only part of the pond, so read them together with weight sampling and water conditions.
- How often should I sample shrimp weight?
- Many farms sample weekly. The point is consistency: same method, same time of day, enough animals to be representative. The average weight and an honest survival estimate give the biomass that the daily ration is based on.
- Can better feeding guarantee faster growth or higher survival?
- No. Growth and survival also depend on seed quality, stocking density, water quality, weather and disease. Good feeding removes avoidable waste; it does not guarantee results.
- What should I compare when buying shrimp feed?
- Compare cost per kg of shrimp harvested, not price per bag: delivered price, the FCR you actually measure, pellet sizes per stage, water stability, freshness on delivery, and the documents supplied with each lot.
Feed industry regions we work with
Feed procurement is local before it is global: raw material basis, freight and installation costs change by region. These are the areas buyers most often name when defining a feed project in English.
United States
Cities and provinces
Iowa · Nebraska · Georgia · Arkansas · Texas · North Carolina
Corn and soybean meal basis with large integrated poultry, swine and dairy operations.
United States →United Kingdom and Ireland
Cities and provinces
East Anglia · Yorkshire · Lincolnshire · Northern Ireland · Munster
Compound feed and imported protein logistics through east coast and Irish Sea ports.
United Kingdom and Ireland →Gulf and East Africa import markets
Cities and provinces
Jeddah · Dubai · Mombasa · Djibouti
Import-driven feed supply where landed cost and port logistics dominate the decision.
Gulf and East Africa import markets →FeedMatch is supplier-neutral. Regional context helps define the requirement; pricing always comes from manufacturer quotations.