FCR calculator: feed conversion ratio and cost per kg of output
To calculate FCR, divide the feed used by the weight gained or output produced over the same period. Feed cost per kg of output is FCR multiplied by the feed price per kg. Use your own records; no benchmark FCR is assumed.
Method reviewed: · Enter your own figures — this tool contains no default prices, nutrient values or benchmarks.
Your inputs
Results
Enter your own figures — this tool contains no default prices, nutrient values or benchmarks.
Worked example: one broiler flock
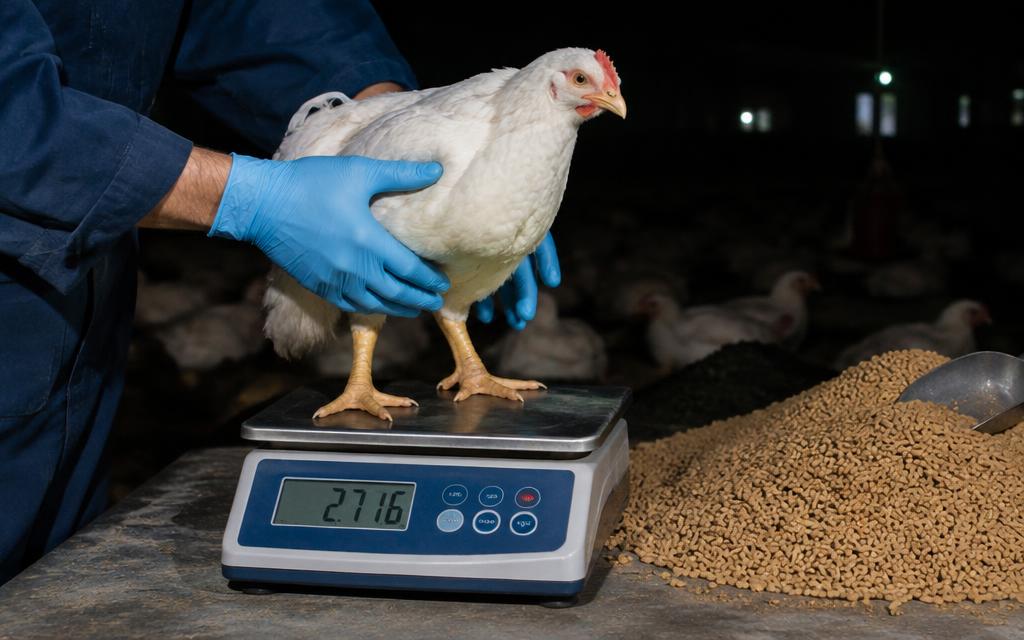
A broiler flock eats 118,800 kg of feed and produces 72,000 kg of live weight (30,000 birds × 2.4 kg). Delivered feed costs 480 per tonne.
| FCR | 1.65 |
|---|---|
| Total feed cost | 57,024 |
| Feed cost per kg produced | 0.792 |
An FCR of 1.65 means 1.65 kg of feed per kg of live weight. With feed at 480 per tonne, every 0.05 change in FCR moves the feed cost by 0.024 per kg of live weight, so compare feed offers on cost per kg produced, measured the same way.
All figures are invented to show the method; they are not market prices, quotes or a recommended diet. Use your own quotes and certificates.
Units by country and convention
Enter feed and output in the same unit (kilograms). The feed price is per metric tonne.
- United States
- Pounds: kg = lb × 0.4536. FCR is unit-free if feed and gain use the same unit, but the price must be converted to per metric tonne.
- Poultry and pigs
- Live weight is the usual output; say whether you used live weight or carcass weight when comparing figures.
- Fish and shrimp
- Use net biomass gain (harvest weight minus stocked weight), not harvest weight alone.
- Dairy
- Feed efficiency is often expressed the other way round (kg milk per kg dry matter intake); this tool uses feed ÷ output.
What to do with your result
More buyer questions
- What is a good FCR?
- It depends on species, breed, age, sex, climate and how FCR is measured. Compare against your own past cycles, or the breed or feed supplier's figures measured on the same basis, not a generic benchmark.
- Should mortality be included?
- State it either way. Adjusted FCR adds the weight of dead animals to output; unadjusted FCR does not. Only compare figures calculated the same way.
- Can a more expensive feed be cheaper?
- Yes, if it lowers FCR enough. Compare offers on feed cost per kg produced, which this tool shows, using results measured on your own farm.
Sources and scope
The FCR formula (feed used ÷ output gained) is standard. The sources below give market and ingredient context; none of them gives a target FCR for your farm. Use your own records for feed used and output, and your own invoices for feed price.
- The State of World Fisheries and Aquaculture 2024 — FAO. Published June 2024.
Scope: Global aquaculture production and feed-use context. Not a farm-level FCR benchmark.
- Food Outlook — biannual report on global food markets — FAO GIEWS. Twice a year (June and November).
Scope: Market outlook for cereals, oilseeds and meals used in feed. Context for feed price, not a price quote.
- Feed Grains Database — USDA Economic Research Service. Updated monthly.
Scope: US feed grain supply, use and prices. US market data; local prices differ.
- Grain: World Markets and Trade — USDA Foreign Agricultural Service. Monthly, with WASDE.
Scope: World supply and trade estimates for corn, wheat and other feed grains. Market context only.
- Feedipedia — Animal feed resources information system — INRAE, CIRAD, AFZ and FAO. Continuously updated.
Scope: Nutritional composition of feed ingredients. Not a formulation or dosing guide.
Links checked 14 October 2026.