
Price per Ton vs Cost per Kilogram of Output: Judging Feed by Results
A lower feed price per ton does not necessarily mean a lower feed cost per kilogram of output. Compare delivered cost, measured conversion, wastage and saleable production on consistent terms.
Short answer · reviewed October 2026
Short answer: Price per Ton vs Cost per Kilogram of Output: Judging Feed by Results
A lower feed price per ton does not necessarily mean a lower feed cost per kilogram of output. Compare delivered cost, measured conversion, wastage and saleable production on consistent terms.
Key takeaways
- !Diagram showing delivered feed cost, feed conversion and feed losses contributing to feed cost per kilogram of output
- - Broiler feed calculator - Cattle feed calculator - Dairy feed cost calculator - Feed buyer FAQ: 100 questions
FeedMatch Editorial Desk
Editorial Team
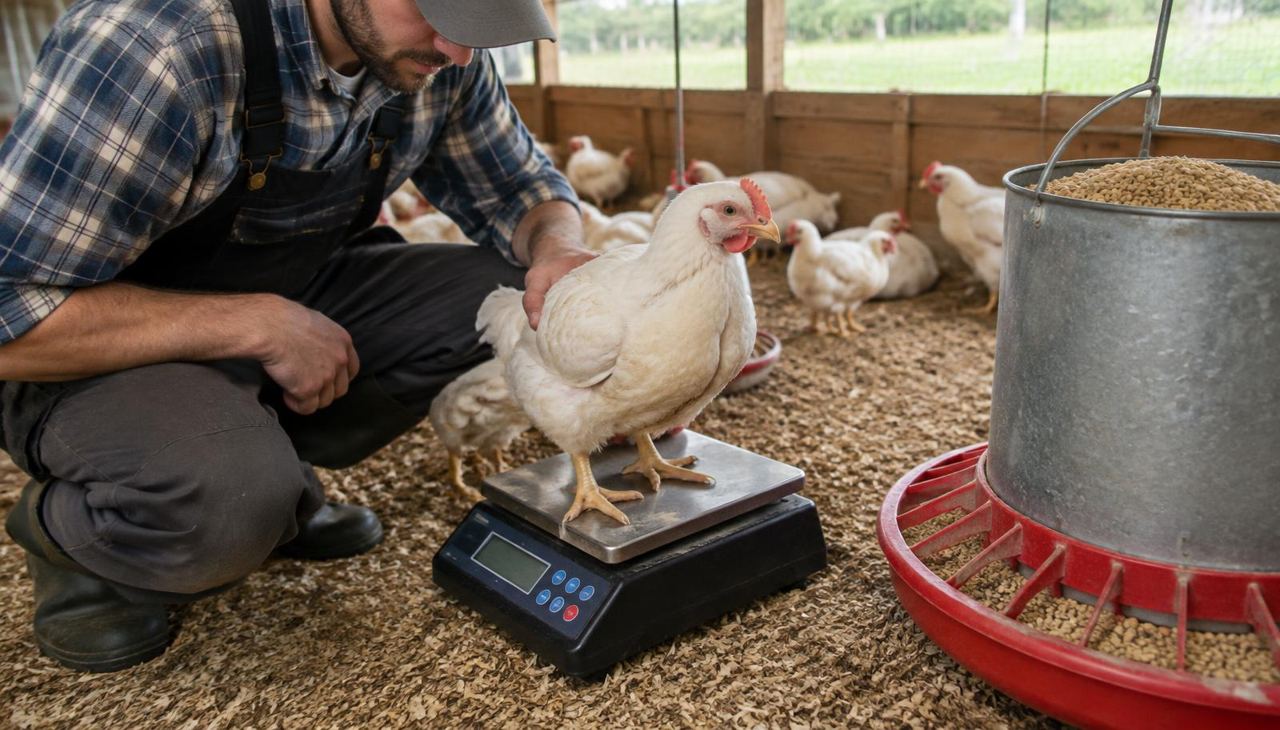
Short answer The cheapest feed per ton is not necessarily the cheapest feed per kilogram of output. The relevant comparison is the cost of feed used to produce a defined quantity of saleable meat, eggs, milk or fish. Delivered price, feed conversion, nutrient density and losses all affect that calculation. Compare offers on the same production basis, using documented farm data wherever possible. A higher-priced feed can have a lower feed cost per kg if conversion or wastage differs sufficiently, but that must be demonstrated—not assumed from a specification sheet or supplier claim.
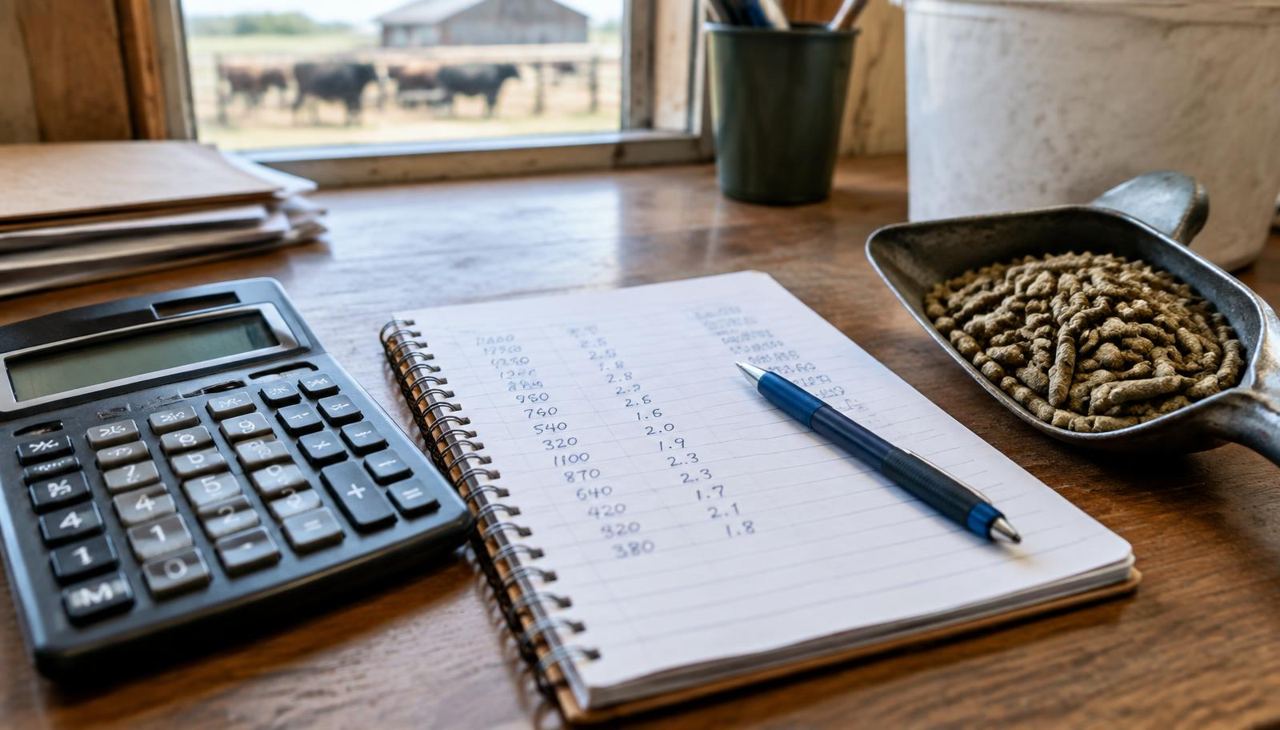
Which output should the buyer measure? Choose the denominator before comparing quotations. Cost per kg of gain normally refers to liveweight gain, not carcass weight or saleable meat. Those measures require different calculations. For eggs, specify kilograms of saleable egg mass rather than mixing egg counts with weight. For milk, use a consistent measure, such as kilograms of milk or a defined energy-corrected basis. For fish, distinguish biomass gain from harvested saleable weight and specify how mortalities enter the calculation. Stocking weight is not newly produced biomass. ### Match the production boundary Use the same species, production phase, measurement period and output definition. Feed consumed by non-producing or lost animals must not disappear from the commercial account. Record rejects and quality deductions separately so that cheaper biological output is not mistaken for cheaper saleable output.
What belongs in the delivered feed price? Start with the cost of getting usable feed to the agreed receiving point, not just the mill-gate quotation. Include freight, unloading, handling charges and non-recoverable duties or taxes where applicable. Separate recoverable taxes from actual costs. Identify packaging charges and any minimum-load conditions. Confirm the currency, quotation validity, delivery terms and payment basis. Credit terms can affect financing cost; storage requirements and order size can affect inventory exposure. Keep these additional ownership costs visible rather than silently folding unlike items into a feed price comparison. Use metric tonnes consistently: one tonne equals 1,000 kilograms. Compare prices on the same moisture basis where needed, particularly when contrasting wet and dry feeds. Reconcile opening inventory, receipts and closing inventory to estimate actual feed disappearance.
How should FCR enter the comparison? Feed conversion ratio, or FCR, generally expresses feed input divided by liveweight gain. Lower numerical FCR means less feed input per unit of gain on that stated basis. It does not automatically prove that a particular feed caused the difference. Check whether reported feed input means feed consumed, feed delivered or inventory-adjusted feed disappearance. Commercial records often measure disappearance, which can already include spillage and other losses. Adding a separate wastage adjustment to that figure would double-count those losses. For milk and eggs, use a clearly defined feed-to-output ratio rather than treating growth FCR as interchangeable with production efficiency. The [feed conversion ratio calculator](/feed-conversion-ratio-calculator) can support a preliminary calculation, but its result is only comparable when input definitions, moisture basis and production boundaries match.
How do nutrient density and wastage change the result? Nutrient density affects how much feed may be needed to supply the intended nutrients. However, a higher crude protein or energy declaration alone does not establish better commercial performance. Digestibility, amino acid balance, species suitability, processing and the rest of the ration matter. ### Compare equivalent feeding systems A concentrate cannot be compared directly with a complete feed without including complementary ingredients and preparation costs. For dairy systems, assess the relevant whole ration rather than attributing all milk output to a purchased supplement. Physical losses also matter: fines, feeder spillage, storage spoilage and uneaten feed can increase purchased feed per unit of output. Define wastage as a share of feed issued or another explicit basis. Use measured losses where available; do not treat a packaging claim as a farm-level loss estimate.
What does an illustrative worked comparison show? The following inputs are **illustrative examples only**, not live quotations, benchmarks or expected results. Both hypothetical feeds serve the same growth phase. Output means kilograms of liveweight gain, and FCR here means feed actually consumed per kilogram of gain. Wastage is a percentage of feed issued, excluding inventory changes. | Illustrative measure | Feed A | Feed B | |---|---:|---:| | Delivered price, USD/metric tonne | 400 | 440 | | Delivered price, USD/kg | 0.400 | 0.440 | | Consumed-feed FCR, kg/kg gain | 1.80 | 1.60 | | Wastage as share of feed issued | 5% | 2% | | Feed issued per kg gain | 1.895 | 1.633 | | Feed cost, USD/kg gain | 0.758 | 0.718 | ### Formula and calculation ```text Delivered price per kg = delivered price per tonne ÷ 1,000 Feed issued per kg gain = consumed-feed FCR ÷ (1 − wastage fraction) Feed cost per kg gain = delivered price per kg × feed issued per kg gain Illustrative A: (400 ÷ 1,000) × [1.80 ÷ (1 − 0.05)] = USD 0.758/kg gain Illustrative B: (440 ÷ 1,000) × [1.60 ÷ (1 − 0.02)] = USD 0.718/kg gain ``` Under these assumed inputs, B has the higher tonne price but the lower calculated feed cost per kilogram of gain. This is arithmetic, not evidence of product performance. If FCR already includes wastage, omit the separate wastage adjustment. Neither result represents total production cost: labour, housing, health, mortality and other costs remain outside this example.
What evidence makes a performance comparison credible? Request the measurement protocol behind any feed price vs performance claim. Useful records identify feed batches, animal starting weights, production phase, stocking conditions, feed accounting, output measurement and the treatment of mortality. Laboratory results can help establish composition, but cannot alone establish farm performance. Where feasible, have a nutritionist or trial specialist design comparable groups or a controlled evaluation. Health status, genetics, environment and management can all confound an apparent feed effect. A before-and-after comparison may reflect seasonal change rather than feed quality. ### Test uncertainty, not just one answer Run scenarios for delivered price, conversion and wastage using defensible ranges from records. Identify the point at which the ranking reverses. If a small plausible change switches the preferred offer, the decision needs stronger evidence or tighter commercial controls.
Which mistakes most often distort the decision? Common mistakes include comparing mill-gate and delivered prices, mixing dry-matter and as-fed quantities, and treating a nutrient guarantee as a performance guarantee. Another is using liveweight gain for one offer and saleable carcass weight for another. Do not mix consumed-feed FCR with disappearance-based FCR or charge wastage twice. Avoid assigning an entire farm's output to one feed ingredient. Keep mortality, rejected output and stock movements inside a consistent accounting boundary. Finally, distinguish feed cost from profitability. A lower feed cost per kilogram does not by itself establish higher margin, faster throughput or acceptable product quality. Those questions require additional production, revenue and risk analysis.
What should a buyer do next? ### Procurement checklist - Define saleable output, production phase and measurement period. - Normalise delivered quotations, moisture basis and payment terms. - Reconcile feed inventory and document the FCR basis. - Record losses once and retain the supporting evidence. - Test alternative assumptions and unresolved specification differences. Use an [animal feed cost calculator from the tools directory](/calculators), then organise commercial assumptions with the [feed TCO supplier comparison calculator](/feed-tco-supplier-comparison-calculator). Tools and calculators provide preliminary planning outputs; they do not replace a nutritionist, engineer, laboratory, lawyer, financial adviser or other relevant specialist. For commercial opportunities of USD 250,000 or more, submit the defined requirement through the [RFQ intake](/rfq-intake). FeedMatch's workflow is human-led and supplier-neutral, with human review before any supplier contact. Documents and relevant public records can be reviewed; FeedMatch is not a certification body and does not audit factories. The buyer retains the supplier decision.
What else do buyers ask about feed cost per kg? ### Is a lower FCR always cheaper? No. The improvement must offset the delivered price difference on a consistent accounting basis. Other production costs can still alter the overall decision. ### Should I use purchased feed or consumed feed? Use inventory-adjusted feed disappearance for commercial accounting where reliable. If using consumed feed instead, account separately for documented losses without double-counting them. ### Can I compare concentrate and complete-feed prices directly? No. Include the complementary ingredients and preparation costs needed to create comparable feeding systems. Check nutrient adequacy with a nutritionist. ### Does the worked example predict farm results? No. All inputs are illustrative assumptions. Farm outcomes require evidence from relevant conditions, consistent measurements and appropriate technical evaluation. ### What should accompany an RFQ? Provide species, production phase, specifications, required volume, delivery location, timing and commercial terms. State the output measure and request evidence supporting any performance claims.
faqs-placeholder
Related pages on FeedMatch
Frequently asked questions
- Is a lower FCR always cheaper?
- No. The improvement must offset the delivered price difference on a consistent accounting basis. Other production costs can still alter the overall decision.
- Should I use purchased feed or consumed feed?
- Use inventory-adjusted feed disappearance for commercial accounting where reliable. If using consumed feed instead, account separately for documented losses without double-counting them.
- Can I compare concentrate and complete-feed prices directly?
- No. Include the complementary ingredients and preparation costs needed to create comparable feeding systems. Check nutrient adequacy with a nutritionist.
- Does the worked example predict farm results?
- No. All inputs are illustrative assumptions. Farm outcomes require evidence from relevant conditions, consistent measurements and appropriate technical evaluation.
- What should accompany an RFQ?
- Provide species, production phase, specifications, required volume, delivery location, timing and commercial terms. State the output measure and request evidence supporting any performance claims.
Feed industry regions we work with
Feed procurement is local before it is global: raw material basis, freight and installation costs change by region. These are the areas buyers most often name when defining a feed project in English.
United States
Cities and provinces
Iowa · Nebraska · Georgia · Arkansas · Texas · North Carolina
Corn and soybean meal basis with large integrated poultry, swine and dairy operations.
United States →United Kingdom and Ireland
Cities and provinces
East Anglia · Yorkshire · Lincolnshire · Northern Ireland · Munster
Compound feed and imported protein logistics through east coast and Irish Sea ports.
United Kingdom and Ireland →Gulf and East Africa import markets
Cities and provinces
Jeddah · Dubai · Mombasa · Djibouti
Import-driven feed supply where landed cost and port logistics dominate the decision.
Gulf and East Africa import markets →FeedMatch is supplier-neutral. Regional context helps define the requirement; pricing always comes from manufacturer quotations.
Move from insight to procurement
Turn the ideas in this article into a live procurement action — supplier-neutral, buyer-controlled, fully documented.